This blog post focuses on observability and discusses the following topics:
- Monitoring metrics
- Tracing with AWS-Xray.
We will use Powertools for AWS, CloudWatch and AWS X-Ray.
What makes an AWS Lambda handler resilient, traceable, and easy to maintain? How do you write such code?
In this blog series, I’ll attempt to answer these questions by sharing my knowledge and AWS Lambda best practices, so you won’t make the mistakes I once did.
- This blog series progressively introduces best practices and utilities by adding one utility at a time.
- Part 1 focused on Logging.
- Part 3 focused on Business Domain Observability.
- Part 4 focused on Environment Variables.
- Part 5 focused on Input Validation.
- Part 6 focused on Configuration and Feature Flags.
- Part 7 focused on how to start your own Serverless service in two clicks.
- Part 8focused on AWS CDK Best Practices.
I’ll provide a working, open-source AWS Lambda handler template Python project.
This handler embodies Serverless best practices and has all the bells and whistles for a proper production-ready handler.
I’ll cover logging, observability, input validation, features flags, dynamic configuration, and how to use environment variables safely.
While the code examples are written in Python, the principles are valid for all programming languages supported by AWS Lambda functions.
You can find all examples at this GitHub repository including CDK deployment code.
Observability

“In IT and cloud computing, observability is the ability to measure a system’s current state based on the data it generates, such as logs, metrics, and traces.” — as described here.
AWS Lambda function observability is required in two domains: technical and business. The technical domain observes and monitors low-level metrics like latency, duration, error rate, and memory usage. The business domain observes key performance indicators (KPIs) defined by your product team.
This blog covers monitoring and tracing as part of the technical domain. Part 1 of the series covered Logging, and Part 3 will cover the business domain.
Monitoring Metrics
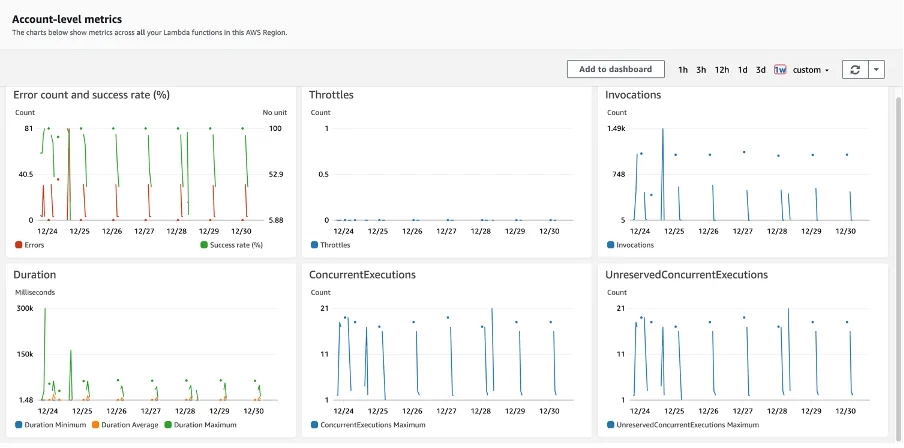
When monitoring your AWS Lambda handler, AWS CloudWatch is the go-to service. It collects service metrics out of the box from numerous AWS services, AWS Lambda included. In addition, it provides macro-level visibility of the current state of your AWS Lambda handlers and the services it integrates with.
AWS CloudWatch measures AWS Lambda metrics in three categories: invocation, performance, and concurrency. You can view these metrics in an AWS CloudWatch dashboard and customize it. You can learn more about them in the AWS Lambda monitoring metrics documentation.
What Metrics Deserve Extra Attention?
This list contains metrics from all three categories. These metrics can help you reduce your monthly fees and even discover issues before they evolve into a production failure.
- AWS Lambda execution time — Strive for the shortest possible duration. Discover anomalies and deviance from averages as soon as they start to appear. In addition, your functions have predefined timeouts. Make sure your handler does not get close to the limit, or you might be risking the termination of your handler.
- Memory usage — Don’t under-provision Lambda memory; monitor actual memory usage and leave enough threshold. Be advised that increasing Lambda memory may reduce the total runtime in some cases. See here.
- Error rate (unhandled exceptions, timeouts) — This number should be close to zero in a healthy environment. Use request-id/correlation id to debug your errors (as mentioned in the first part of the series). In addition, pay attention to changes in average error rates because any anomaly here might indicate a failing service.
- Provision concurrency-related metrics, throttling, and usage percentage. These metrics provide insight as to your actual provision concurrency usage. These metrics can prevent inadequate performance by under-provisioning (a lot of throttling and hitting the maximum concurrency limit) or wasting your money by over-provisioning and having a primarily idle system. You should always tweak and be on the lookout for optimizing these configurations.

AWS CloudWatch Alarms
Another important aspect of AWS CloudWatch is Alarms. Alarms monitor measured metrics and trigger when a predefined threshold is reached. Alarms have several states: ‘OK,’ ‘ALARM,’ and ‘INSUFFICIENT DATA.’
You should pay extra attention to alarms at the ‘ALARM’ state. This state means that the measured metric is outside the defined threshold, and further investigation or immediate actions are required to bring back the metric to the healthy threshold.
Alarms can have actions. They can integrate with other AWS services such as AWS SNS and AWS EventBridge. You can send an SMS, email, or even trigger an AWS Lambda function that changes configuration or starts a deployment pipeline. These integrations mean that you can create complex alarms.
A typical alarm action is an action that notifies a “fire fighting” support engineer that something terrible has happened or is about to happen, and they are required to take the initiative and save the day.
Rule Of Thumb
- It would be best to define alarms for your handler over the metrics I’ve mentioned in the blog. Set proper thresholds and limits. Learn the accepted execution time boundaries, and determine how your healthy service behaves. It should be a combination of anticipated usage, minimum acceptable customer experience, and cost.
- Don’t stop at AWS Lambda metrics. AWS CloudWatch monitors many AWS services that integrate with AWS Lambda. Services include AWS SQS, API Gateway, SNS, EventBridge, and more. Together they tell the complete story of your production environment.
Read more about CloudWatch alarms in the AWS documentation.
All in all, AWS CloudWatch is an excellent monitoring service. It has many advanced utilities such as Lambda insights, anomaly detection, etc. Some might be useful to you more than others. I urge you to research and determine what features give you the most value, as it’s impossible to cover all of them in this blog.
However, keep in mind that 3rd party services such as DataDog, provide similar or extra capabilities and integrate well with AWS CloudWatch. Research what the competitors offer. They might serve your needs better.
Tracing
AWS CloudWatch monitors AWS Lambda at the macro level. However, that’s not enough. What about the micro-level? How can you venture into the bowels of your AWS Lambda handler and pinpoint bottlenecks and performance issues?
Let’s assume that an AWS CloudWatch alarm that monitors the duration of your handler has gone into the ‘ALARM’ state. How do you debug it?
AWS X-Ray and AWS Lambda Powertools tracer utility to the rescue.

AWS X-Ray
“With X-Ray, you can understand how your application and its underlying services are performing to identify and troubleshoot the root cause of performance issues and errors. X-Ray provides an end-to-end view of requests as they travel through your application, and shows a map of your application’s underlying components.” — AWS documentation
TimeLine Viewer
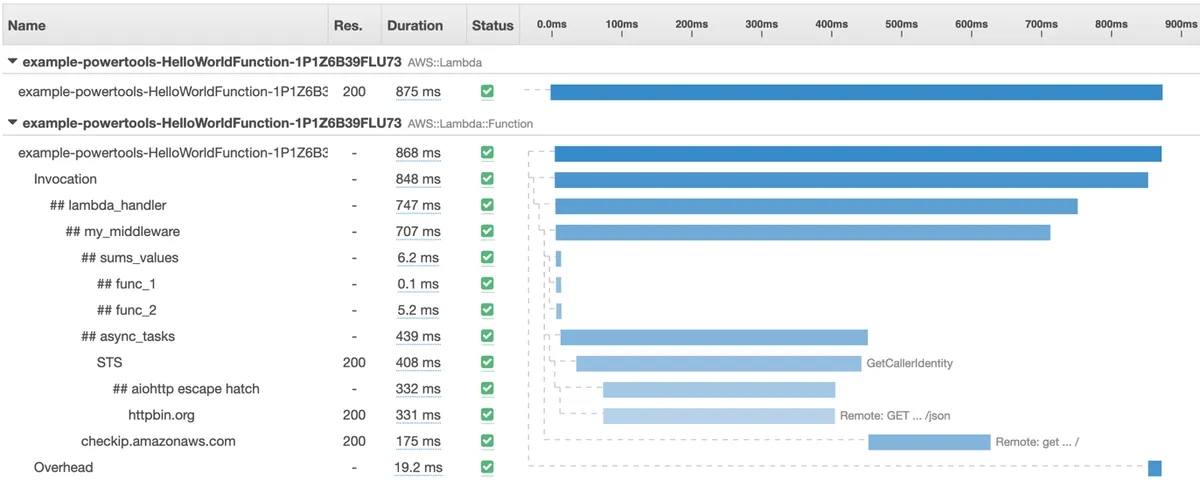
The most helpful utility in AWS X-Ray, in my opinion, is the Timeline viewer. It allows you to view a single AWS Lambda function invocation and analyze its inner working and performance. Every inner function or HTTP call is traced and presented in an easy-to-read table.
AWS X-Ray allows searching for single AWS Lambda invocation traces by service name, request-id, and other parameters.
Finding your performance bottleneck has never been easier!

Combining Traces
Another valuable feature of the timeline view is displaying connected traces in a single timeline view. If your AWS Lambda handler sends an HTTP request to another traced AWS Lambda handler, the specific invocation tracing of the other handler will also appear under the same page. Both tables are presented on a single page. So convenient!
This feature is perfect for performance optimization and “milliseconds” hunting to help you take your code to the max. It eases the debugging process of pinpointing the troublesome service call that increases the overall duration.
Service Map
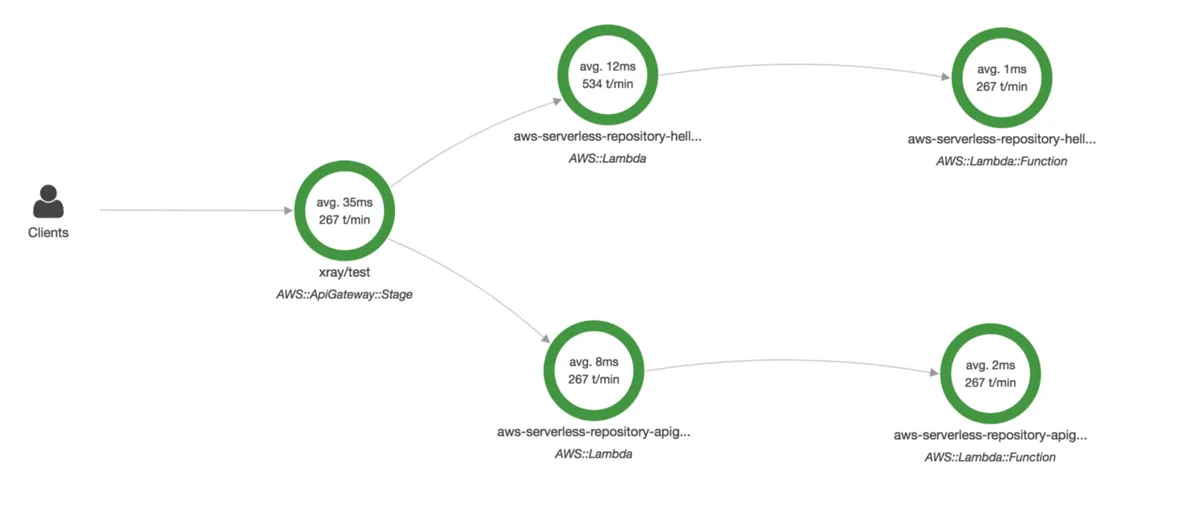
Lastly, Service Map is another helpful feature. Traces don’t lie. Traces expose service connections that you didn’t know existed or were hard to comprehend by looking at the code. The Service map visualizes a request flow between services in a graph instead of a table, like the TimeLine viewer.
See more in-depth information in the CloudWatch ServiceLens documentation.

OK, Where Do I Sign Up?
Let’s make our AWS Lambda handler traceable at AWS X-Ray and AWS CloudWatch Service Map. We can achieve this by adding the tracer utility from AWS Powertools.
AWS Lambda Powertools provides a thin wrapper of AWS X-Ray SDK through the usage of decorators. To start using AWS X-Ray, you need to do two things:
- Define a global tracer object and decorate the handler and any inner functions.
- Give permissions to the AWS Lambda function to send data to AWS X-Ray as described here.
Let’s add the tracer utility into the AWS Lambda handler code presented in the first blog. The handler had logger functionality.
The global AWS Lambda Powertools classes instances (logger and tracing) will be defined in the “utils/infra.py” file. These global instances are defined in a shared utility folder so they can be reused by all service layers and files across the AWS Lambda. They can also be shared by multiple handlers when your service expands and new handlers are added to the “handlers” folder.
At line 10, we create a global tracer instance with an exact service name.
The handler resides in the “handlers” folder in a file called “my_handler.py”:
In line 6, we import the tracer from the utility folder.
In line 14, we decorate the handler, so traces are captured across handler invocation and are sent to AWS X-Ray at the end. From my experience, it’s best to set “capture_response” to False if your handler might return data with Personally identifiable information (PII) or large response objects. See the Powertools Tracer documentation for more details.
In line 9, we add tracing of the inner function “inner_function_example.” This makes the inner function traceable and exposes its specific execution time in AWS X-Ray. You should use this decorator to trace any nontrivial functions that might have performance issues- if it sends an HTTP request to an external service, uses AWS SDK, or does complex calculations, decorate it.
You can find all code examples at the AWS Lambda Handler Cookbook GitHub repository.
One last thing — Tracer Annotations
You can define custom annotations to help you find traces faster and easier in AWS X-Ray. For example, You can find traces by customer id. You can learn more about it in the Tracer annotations and metadata documentation.
However, while this mechanism is excellent for making traces easier to find, it is not a logger replacement. Don’t add too much metadata via the annotation mechanism; log it instead.
Rule of Thumb
- Reduce tracing costs. AWS X-Ray tracing costs can add up. AWS CloudWatch alarm and monitors will let you know if your AWS Lambda handler performance is degrading. I suggest you disable the tracer by default and only enable it (via an environment variable or explicitly) while doing benchmark testing or while trying to debug a performance issue that can NOT be resolved by examining logs.
- Conduct performance benchmarks as much as you can while considering cost implications.
- Improving execution time and latency is not trivial — While this topic deserves a separate blog post, here are some quick tips for improving both parameters: enabling provisioned concurrency (remove cold starts), increasing memory size, and running your AWS Lambdas on Graviton processors. Click here for more details.
- It’s essential to keep in mind that using AWS Powertools tracing utility does not restrict you to using only AWS X-Ray. Many 3rd party tracing solutions offer AWS X-Ray integration (see DataDog documentation). Do your research, find the tool that works best for you and provides you with the best overall observability experience.
Coming Next
This concludes the second part of the series. Join me for the next part, where I implement business domain metrics.
Special thank you goes to:
- Ben Heymink
- Alexy Grabov
- Yaara Gradovitch


