
CloudWatch custom metrics, often utilized as key performance indicators (KPIs), possess versatile applications beyond their conventional use. Powertools for AWS Lambda simplifies the process of writing these metrics, unlocking innovative use cases.
This article will guide you through personalizing observability by integrating CloudWatch metrics into mobile push notifications, a strategy that significantly enhances mobile app engagement. If you're a data engineer looking to instrument an ingestion pipeline, or an application developer aiming to deliver user-specific metric notifications, this post offers valuable insights tailored for you.
Background - The SmartHunter
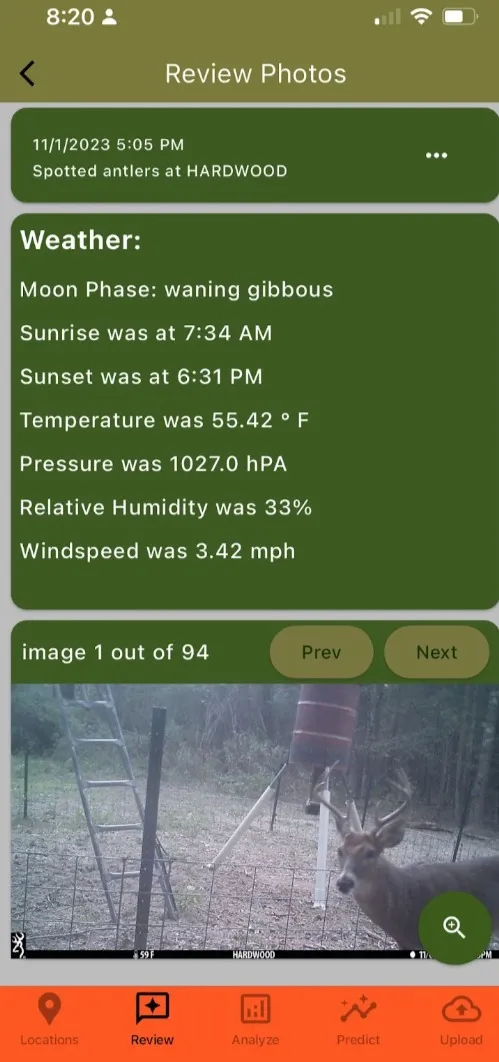
Before we discuss CloudWatch metrics, let me provide some context about how I arrived at my usage of CloudWatch metrics. In short, I have written a mobile app, The SmartHunter, which uses AI to help hunters be as proficient as possible when they choose to go on a hunt. For this app, users upload images from their various trail cameras, and the cloud backend service uses AI to help them understand where and when they should plan their expeditions. So, when users upload these images (usually several thousand at a time), an ingestion pipeline (composed of a series of lambda functions) processes those images. Besides the core processing of these images, I wanted to provide observability to the users of the app, giving them insights into how many images were processed, and what information was gleaned from the images. Below is the app, showing the ability to review pictures.
I am an avid user ofPowertools for AWS Lambda and I am using metrics for my purposes - observing the system and alerting me to how system processes are running. (If you are not familiar with Powertools, it is essentially an amazing set of tools that encapsulates best practices and patterns for building Lambda-based applications.) However, I didn’t want to provide or expose a CloudWatch dashboard to my app users. But I did want to find a way to expose those metrics, and I believe that push notifications help drive engagement with your app. So I set out to figure out how I could utilize these metrics and expose those to my users through the mobile app.
AWS CloudWatch Metrics To the Rescue
If you are new to CloudWatch Metrics, see this great blog series on observability and business domain metrics. For my application, there are three key metrics that users care about when they upload images:
- How many images were uploaded?
- How many were successfully processed?
- What species were identified in those images?
As a developer, I might care about those numbers in the aggregate to know how the system is performing. However, an individual user only cares about metrics about their images. That is where a dimension comes in. A dimension is simply metadata attached to a metric that allows you to “slice and dice” the metric. In my use case, I assign a dimension of “Ranch ID” to each metric - this is simply an identifier to say this metric applies to this person’s ranch (a location on a map). As mentioned previously, Powertools makes this very easy - below is a code snippet from one of my Lambda functions:
The key here is the dimension, line 12 - as you will see later, this allows me to query for metrics tagged with that dimension, which provides the personalization at the user level. In this instance, I am creating a metric called “ImageIngested,” which is the total ingested images for that operation for that user (as indicated by the dimension).
And finally, Line 13 is what creates the metric and writes the metric to CloudWatch. In this instance, the unit of the metric is “Count,” but notice that MetricUnit is an enum and can include units like “seconds.” Powertools makes this one line of code - much simpler, more readable, and ultimately more maintainable than if you usedboto3.
Solution High Level Overview
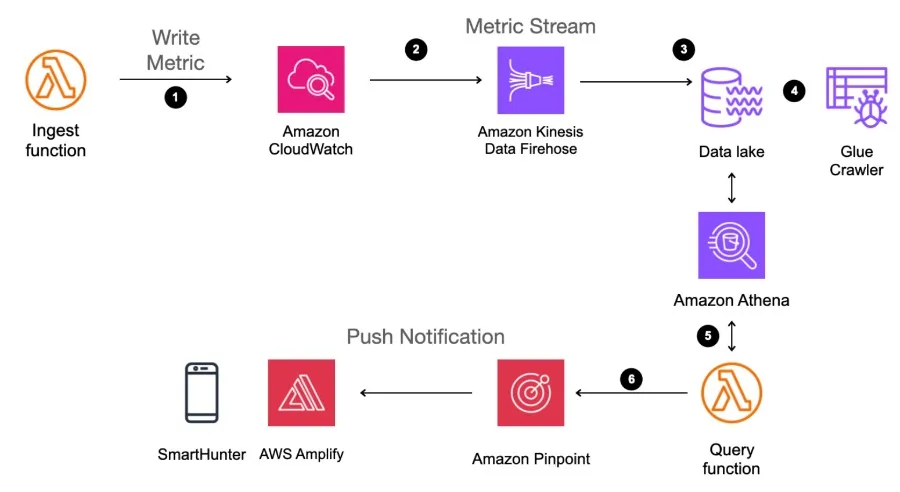
Now that we created the metrics, let’s review the process that drives the metric creation and how those metrics get delivered to the users. Below is a high-level architecture showing how metrics are created, persisted byCloudWatch Metric Streams, and then queried at a later time to send push notifications to users.
Let’s break this down:
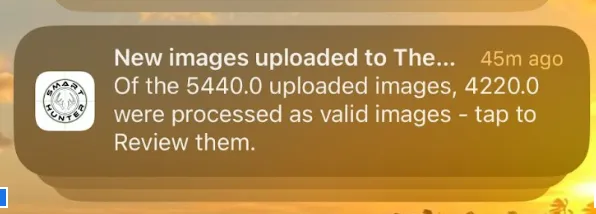
Step 1: The “Ingest function” adds the metric utilizing Powertools. And as described earlier, each metric is contextualized to the user by adding a dimension to the metric that is specific to that user/tenant, specifically their ranch identifier (ranchid). Below is the push notification showing two metrics, the number of images uploaded, and how many were valid images.
Step 2: CloudWatch has a service, CloudWatch Metric Stream that can send metrics to several destinations, one of which is Kinesis Firehose.
Step 3: Kinesis Firehose delivers the metric data to S3.
Step 4: A Glue Crawler can be configured to index and catalog the metric data (now in S3) as a table in the Glue Catalog. This allows you to query this data from a lambda function utilizing Athena. In effect, I like to think of this as a “metrics lake”, because I have all my metrics available as tables in a Glue database and can query with SQL. This allows for use cases where I can go back and look at a customer’s activity over time, which could be used to conduct further Amazon Pinpoint campaigns.
Step 5: Once the nightly ingestion process is completed, another lambda function runs that queries the Glue Table, using Athena. This query retrieves the most recent metrics (the last 24 hours) and slices those by the dimension (ranchid). This now returns a resultset of metrics by dimension, which can be used to send the metrics to each user.
Step 6: After the Athena query, the “Query function” sends the push notifications via Pinpoint. The push notification is a “deep link” that takes them to the relevant section of the app where they can review the images they uploaded and the quality of the image recognition model.
Retrospective: Was it worth it push metrics to users in this manner?
It’s probably worth discussing why I chose to utilize CloudWatch metrics this way, and what I see as the pros and cons of such implementation. As stated previously, I wanted to drive engagement with my app, and everyone knows that push notifications are a great tool to do that. Next, I wanted to provide observability to users of these processes that are critical to them being successful with the app. CloudWatch Metrics and the implementation of metric streams seemed intuitive to me because it would capture all the statistics about when the event happened, as a part of the process of creating the metric. I also liked that the metrics would be persisted for me to do a more sophisticated analysis at a later date, as the need arises.
The cons to the approach chosen is that I now have incurred some other costs, namely Glue Crawler, Lambda, and Pinpoint costs, on top of the CloudWatch Metric costs that I am already incurring. In the end, though, the value of having push notifications and the potential higher customer engagement outweigh the cons.
Summary
Hopefully, this post demonstrates how you can improve application engagement through CloudWatch metrics. What this does is allow you to push metrics to your customers/users, and thereby drive engagement with your platform by giving them deep insights into processes where they are uploading thousands of images to your app. Hopefully, this post also shows how easy it is to use metrics when using Powertools. I take every opportunity I can to tell people how awesome Powertools is.