In this two-post series, you will learn to monitor serverless services with CloudWatch by building dashboards, widgets and alarms with AWS CDK.
In this post, part two of the series, we will use AWS CDK to monitor a sample serverless service with CloudWatch dashboards according to the principles presented in the first post in the series.
In the first post, you will learn what it means to monitor a serverless service, why it is essential, and how to build CloudWatch dashboards to monitor your serverless service with widgets. The widgets display information from CloudWatch logs, metrics, custom metrics, and define CloudWatch alarms as part of a proactive approach.
Introduction
Utilizing AWS CloudWatch dashboards enables centralized monitoring of API Gateway, Lambda functions, and DynamoDB, providing real-time insights into their performance and operational health. By aggregating metrics, logs, and alarms, CloudWatch facilitates swift issue diagnosis and analysis across your serverless applications. Additionally, setting up alarms ensures immediate reaction to anomalous activities.
In this post, we will write CDK code that builds CloudWatch dashboards that monitor logs and metrics and create alarms for a sample serverless service.
We will build a dashboard that monitors a sample serverless service, the 'orders' service.
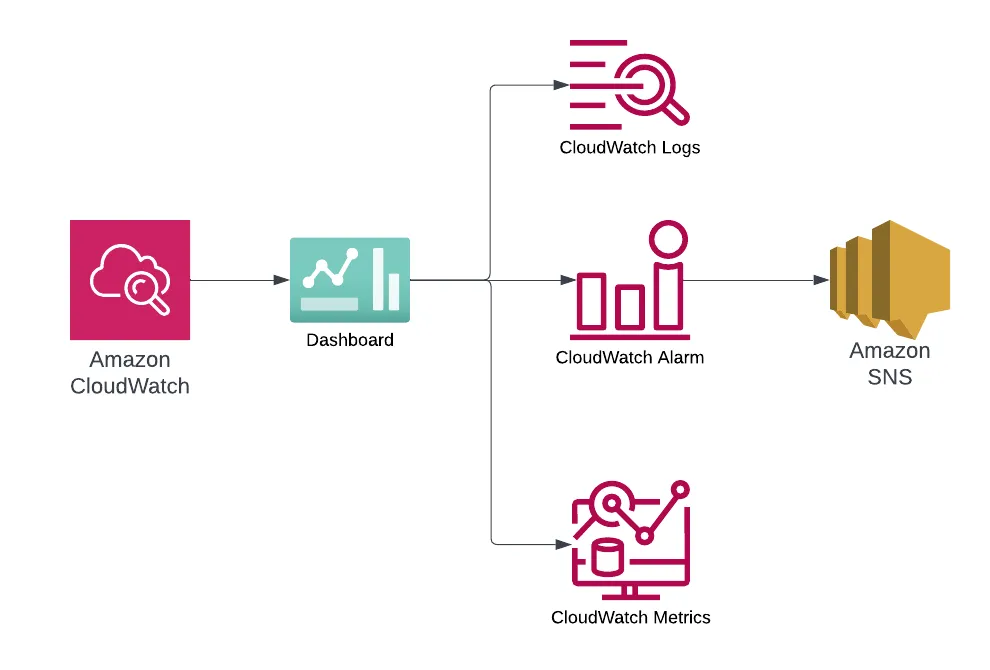
These are the resources we will build with AWS CDK.
Sample Serverless Service Architecture
The 'orders' service allows users to order products.
Let's build a monitoring dashboard for this service that implements the concepts introduced in the first part of the series.
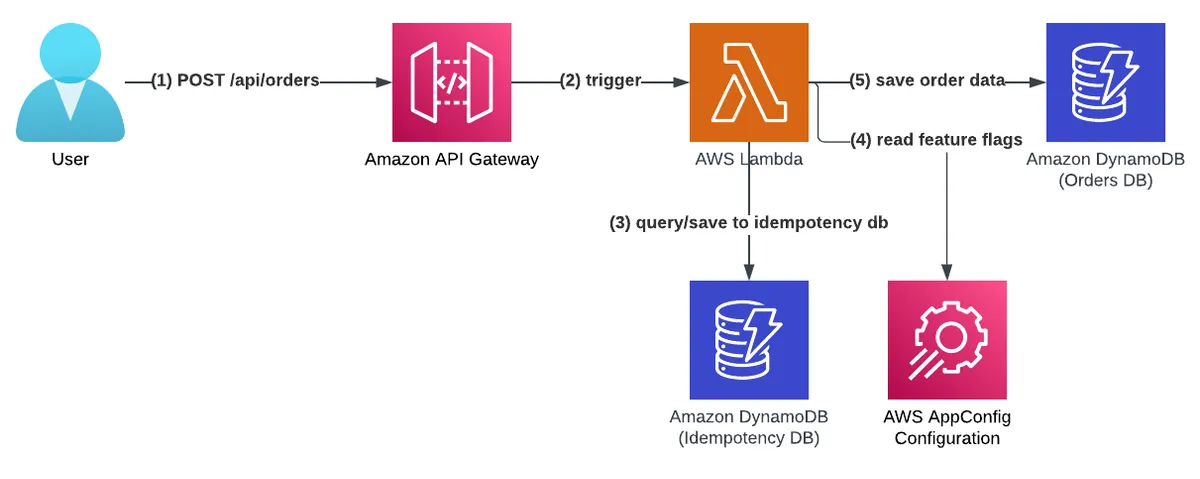
We aim to monitor the service API gateway, Lambda function, and DynamoDB tables and ensure everything is in order. In addition, we want to visualize service KPI metrics.
We will build two CloudWatch dashboards, a high-level summary and a low-level summary, each serving a different persona. The dashboards will display widgets of CloudWatch logs (error logs for our Lambda functions) and CloudWatch metrics of various resources.
In addition, we will define CloudWatch alarms to notify us of critical performance degradations and errors.
If you wish to understand the reasoning behind this approach and why monitoring is essential, read the first part of this series.
You can find the monitoring construct code on GitHub.
\* The code is part of my AWS Lambda Handler cookbook template project.
This repository provides a working, deployable, open-source, serverless service template with an AWS Lambda function and AWS CDK Python code with all the best practices and a complete CI/CD pipeline. You can start a serverless service in 3 clicks!
CDK Code
We will use an open-source library: cdk-monitoring-constructs.
The library supports multiple programming languages: Python, TypeScript, Java and C#.
The library provides "easy-to-use CDK constructs for monitoring your AWS infrastructure with Amazon CloudWatch." It abstracts the CW widget creation and simplifies it with out of the box support for many AWS services such as API Gateway, Lambda, DynamoDB and more.
The library utilizes the concept of factory classes. You have factory classes for creating a widget based on log group or based on CW metrics for a large number of commonly used AWS services. You can also create CW alarms with ease and monitor custom CW metrics (KPIs). You can use your factory classes to define custom colors, font sizes, sizes, default alarm settings, and more.
We will use the library to monitor the 'orders' service resources: Lambda function, Api Gateway, and DynamoDB with ease.
Below is an L3 CDK construct that builds all the monitoring resources. Let's review what it creates and deep dive into each section.
We will review three different functions that build all the resources.
'_build_topic' - builds the SNS topic that alarms will send alarm details when triggered.
'_build_high_level_dashboard' - builds the high-level dashboard.
'_build_low_level_dashboard' - builds the low-level dashboard.
As input, we receive the API Gateway resource, two DynamoDB tables, and a list of Lambda functions to monitor.
Let's go over each of the functions in lines 14-16.
Alarms' Topic
CloudWatch alarms are useless unless they have an action once they trigger. We have configured the alarms to send an SNS notification to a new SNS topic. From there, you can use any subscription - HTTPS/SMS/Email, etc. to notify your teams of the alarm.
In lines 24-29, we define the KMS key that will be used to encrypt SNS messages at rest.
In lines 30-34, we define the topic and use the key we previously described.
In lines 37-44, we set a permissions policy and allow CloudWatch to publish messages to the topic. This will occur once an alarm gets triggered; CW would send an SNS message describing the alarm.
Now that we have the SNS topic, we can pass it to the following functions used when building CW alarms.
High Level Dashboard
This dashboard is designed to be an executive overview of the service.
Total API gateway metrics provide information on the performance and error rate of the service. It also includes an alarm on the API Gateway error rate.
KPI metrics are included in the bottom part as well.
Personas that use this dashboard: SRE, developers, and product teams (KPIs).
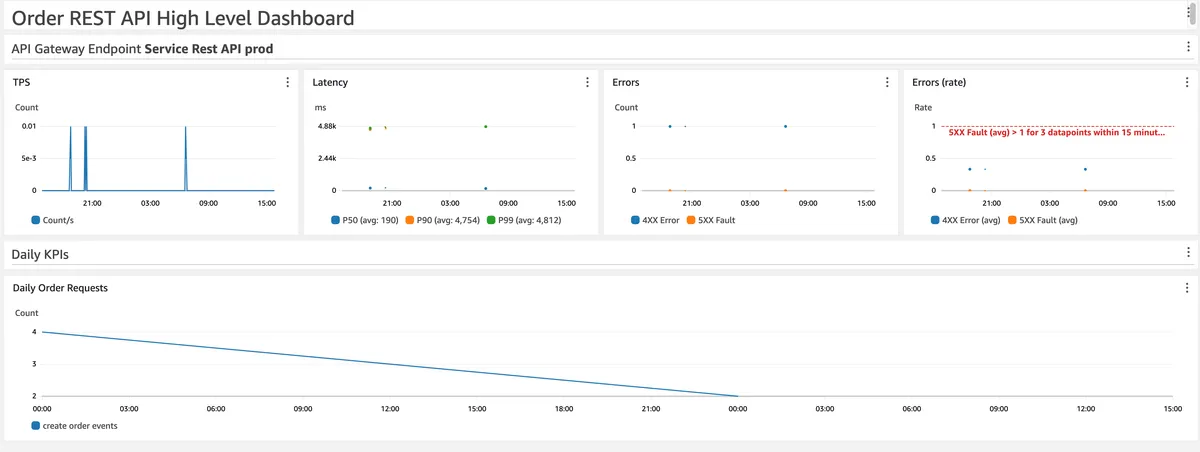
Lets review the function '_build_high_level_dashboard' that generates this dashboard:
In lines 26-34, we build the dashboard facade. It represents a dashboard in CW. This class holds all widgets we create and has multiple factory functions that build widgets and alarms.
You can override its default settings and set the default factory for alarms, widgets, and metrics with your custom settings.
In lines 29-32, we create an alarm factory and set it so that all alarms produced by the facade will have an action to send to the SNS topic we previously defined once triggered.
In line 35, we add a header to the dashboard.
In lines 36-39, we add multiple widgets that monitor our API Gateway - the top four widgets. They are provided out of the box as part of the library. In line 38, we add an alarm for an error threshold for the API Gateway (HTPP 4XX or 5XX). The alarm will use the default SNS action defined in the previous lines.
In lines 40-51, we create the bottom widgets that monitor the custom CloudWatch metric under the namespace 'orders_kpi' named 'ValidCreateOrderEvents.' We can add multiple metrics to one widget group (line 50), but in the 'orders' service, we have only one.
Low Level Dashboard
It is aimed at a deep dive into all the service's resources. Requires an understanding of the service architecture and its moving parts.
The dashboard provides the Lambda function's metrics for latency, errors, throttles, provisioned concurrency, and total invocations.
In addition, a CloudWatch logs widget shows only 'error' logs from the Lambda function.
As for DynamoDB tables, we have the primary database and the idempotency table for usage, operation latency, errors, and throttles.
Personas that use this dashboard: developers, SREs.
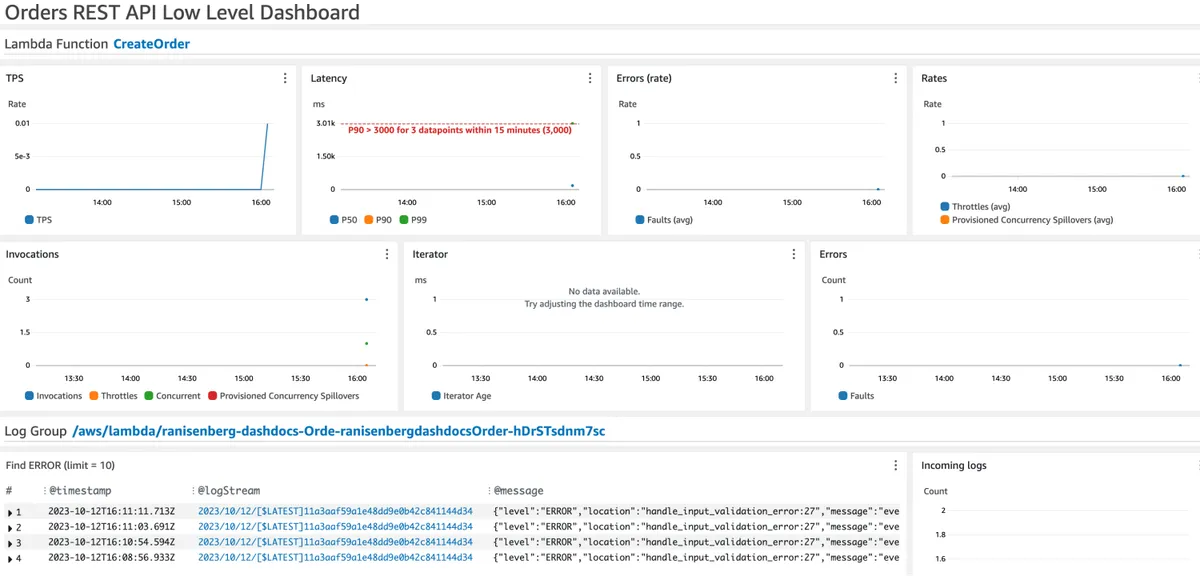
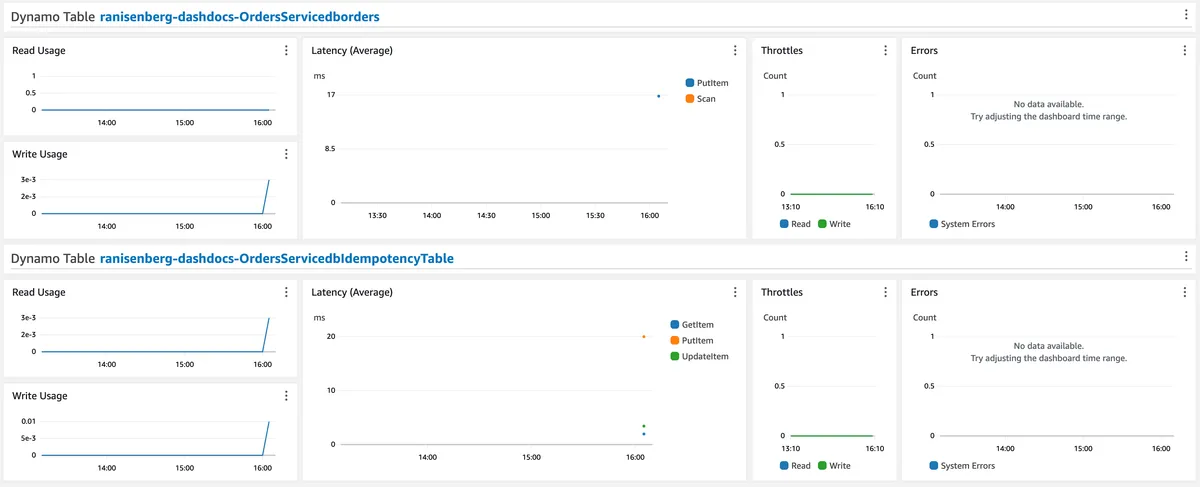
Let's review the CDK code that builds these widgets:
In lines 36-44, we build the dashboard facade. It represents a dashboard in CW. This class holds all widgets we create and has multiple factory functions that build widgets and alarms.
In lines 39-42, we create an alarm factory and set it so that all alarms produced by the facade will have an action to send to the SNS topic we previously defined once triggered.
In line 45, we add a header to the dashboard.
In lines 46-56, we build the top two rows of the dashboard. Two per Lambda function - in this case, we have only one function. We use the built-in widget creation for the Lambda function to monitor all the crucial aspects of the function. In lines 47-49, we define an alarm that monitors the p90 duration of the function. If you want to learn more about percentile metrics, check out my first post.
In lines 51-56, we define a widget that displays logs from the Lambda function log group but only ERROR logs.
In lines 58 and 59, we use the built-in DynamoDB widget support of the library to monitor the main DB and the idempotency table we have.
Full CDK Snippet
Here's all the code together:
You can find the updated monitoring construct on GitHub.


