Last month I was tasked with estimating my Serverless service 'SLA' service level agreement. At first, I needed to figure out how to approach the task.
For all I knew, SLA was a legally binding contract between a company and its customers regarding its services' availability and predicted downtime over a year.
In addition, if the company failed to uphold it, it had to reimburse its customers.
This blog post is the fruit of my research and thought process.
In this blog post, you will find my definitions, guidelines, and approach to understanding SLA, SLI, SLO, RTO & RTP, and other related definitions in a Serverless service context, including estimating a Serverless service availability. In addition, you will learn how to improve your RTO and reduce service downtime.
Disclaimer: I'm not a lawyer, just an architect trying to make sense of everything, so please consult your legal team before publishing an SLA.
Definitions
Let's review some basic terms and definitions before estimating a sample Serverless service potential SLA.
Service Disaster
Before we can talk about service health or availability, we need to understand what is a service disaster.
A service disaster is an event where the critical business use case of a service ceases to work for some time. However, it does not mean that the entire service is offline.
Think of a log viewing service. The service is online; you can log in but not view any logs. Does that qualify as a service disaster?
I'd argue that yes. The critical business use case is that users can view logs, and this flow is broken. I can log in to the service, but I cannot do anything.
On the other hand, you might have a secondary business use case that ceases to work but might be less critical to the customer. Sure, it's an annoyance and a production issue. However, the customer can still use the service in this case, so it might not get considered official "downtime."
To be clear, your product and legal teams are the ones that defines these use cases
It's essential to understand them as they directly affect downtime.
Note: different business use cases can have other availability requirements, but in this guide, I will focus on the simple use case where they all share one SLA definition.
SLI
Service level indicators (SLI) are the actual numbers measuring the health and availability of a system. We will record each disaster downtime and calculate the service availability using the following formula:
Availability = Uptime ÷ (Uptime + downtime)
For example, A service was online for 700 hours over a month and 30 hours of downtime due to various disasters.
Availability = 700 ÷ (700 + 30) \* 100
Availability = 700 ÷ 730 \* 100
Availability = 0.958 \* 100
Availability = 95.8%
The organization strives to improve and get the SLI closer to the SLO.
SLO
Service level objective (SLO) is the organization’s internal goal for keeping systems available and performing up to standard.
This percentage represents where the organization wants to be in terms of availability, where it strives to be but currently IS NOT there.
It is usually higher than the SLI and SLA.
SLA
A service level agreement (SLA) defines the level of service expected by a customer from a supplier, laying out the metrics by which that service is measured, and the remedies or penalties, if any, should the agreed-on service levels not be achieved. - https://www.cio.com/article/274740/outsourcing-sla-definitions-and-solutions.html
For example: AWS Code Deploy SLA:

AWS defines the compensation terms for when the contract is breached and the monthly service uptime percentage is below the SLA threshold.
What does 99.9 mean, though?
According to the SLA calculator, 99.9 translates to:
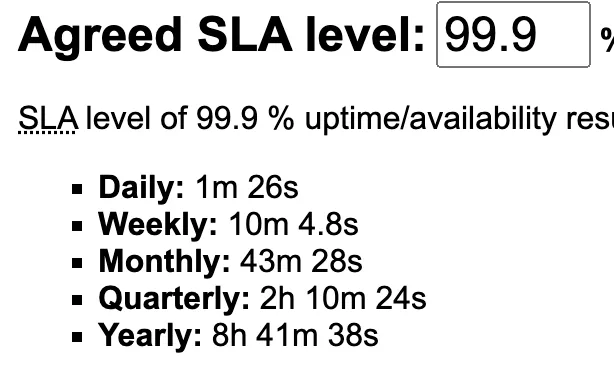
So if AWS CodeDeploy is down more than 43 minutes and 28 seconds in a single month, we, the customers, get 10% service credit back. Nice!
If there has been a more significant downtime, we get more credit back, all the way to a full credit for 95% SLA or less, which is more than 1.5 days of downtime in a single month.
Business Example
Your service SLI has been 99.94% for the past year, translating to 5 hours and 12 minutes of downtime. The SLI is based on actual service disaster downtime incidents.
On the other hand, let's assume your internal availability goal, SLO, is 99.99% which translates to about 4 minutes of monthly downtime, which is rather ambitious.
However, you want to give yourself a little "head" room - so you define your SLA as 99.9% availability.
Your SLI is above the SLA, so customers are happy, and there's room to improve to get to the ambitious SLO.
Service Layers
A service has two layers that interest us in the context of availability:
- Application layer - Business code, in our case, is the Lambda handlers code.
- Infrastructure layer - Serverless resources and configuration: DynamoDB, AppConfig configuration, Step function state machine, etc.
Availability Zones Failover vs. Region Failover
All services must not have a single point of failover.
You might have a global service where failover between regions is required; for example,
If your service does not respond in us-east-1, you must route your customer to the fallback region, us-east-2, as soon as possible.
Most Serverless services support multiple availability zones failover and automatic recovery out of the box.
Services such as DynamoDB and Aurora support the mechanism of the global table, which enables an automatic region failover. Serverless does make these aspects quite simple as long as you configure them correctly in your infrastructure as code configuration.
RTO
RTO helps to understand SLA service uptime percentage. Lets define it:
The recovery time objective (RTO) stands for Recovery Time Objective and is a measure of how quickly after an outage an application must be available again. In other words, the RTO is the answer to the question: “How much time did it take to recover after notification of business process disruption?“ - druva.com
Four Stages of Disaster Recovery Handling
A disaster can manifest itself in both service layers. It can happen due to infrastructure resource misconfiguration or a bug in the Lambda function code.
Handling a disaster consists of several stages. The duration of these stages makes for the service recovery time, the RTO:
- Time to first Response: It takes the firefighter developer or support engineer to start handling the disaster from the beginning of the first alert or customer notification.
- Time to find the cause: the time it takes the firefighter developer or support engineer to find the root cause of the disaster. Developers must review logs, metrics, and traces to figure out the issue.
- Time to fix: the time to deploy a bug fix, revert previous commits, or disable a feature flag. These changes trigger a CI/CD pipeline run to production. Best case scenario: a code revert is pushed and deployed on the last commit(s), which does not require further development of a bug fix. Worst case scenario: a developer writes new code and tests to fix the issue while the service is down, translating to extra downtime.
- Time to notify users that the service is back and running.
Many factors can impact the time developers spend in stages 2 & 3, for example:
- Code coverage percentage.
- Service code complexity.
- Service observability quality.
- Service dependency on external services.
- Team proficiency.
- Team's readiness for disaster recovery, i.e backup scripts, disaster handling training.
As you can see, RTO can vary between several minutes to several hours or even days.
Stage numbers 2 and 3 have the most potential to cause extended downtime.
RTO of AWS Managed Services
On the other hand, RTO of managed AWS services is the time that takes the infrastructure to:
- Identify that one availability zone or region is down.
- Route (failover) the user or service data to a different A/Z or region.
In managed AWS services, A/Z failover and recovery are made automatically, making the RTO speedy. DynamoDB is an example for a managed AWS service that handles that for you.
As for regional failovers, Route53 supports automatic DNS failover, which can route to a different region if one region is down.
DynamoDB and Aurora's global tables mechanism are other examples of AWS-managed services that automatically handle regional downtime for you, thus making the RTO speedy.
How Do You "Guesstimate" RTO?
I call it a guess; you need years of SLI data to estimate the RTO accurately.
If that's not the case, you need to make a calculated "guess" while considering the four stages of disaster handling and the factors that impact them.
We will discuss how you can improve these factors and the RTO in the last part of this post.
RPO
A recovery point objective (RPO) is the maximum length of time permitted that data can be restored from, which may or may not mean data loss. It is the age of the files or data in backup storage required to resume normal operations if a computer system or network failure occurs. To more concisely define the difference: RPO is the time from the last data backup until an incident occurred [that may have caused data loss]. - AWS Well-Architected
RPO depends on database backup frequency.
If you use Serverless databases, you are in luck. They have best-in-class point-in-time recovery and backups mechanisms.
When appropriately configured, the RPO can be down to minutes with DynamoDB point in time and Aurora backups.
Putting RTO & RPO Into a Business Continuity Example
In our sample service, a typical RTO is one hour, the RPO is 15 minutes, and the last database backup occurred at 12 PM.
At 12:15 PM, seconds before the next backup takes place, a disaster occurs.
The RTO is one hour on average, which was indeed the case in this disaster. At 1:15 PM, after one hour of downtime, the service is back online. Our data loss, in this case, is 15 minutes, as the last backup occurred at 12:00 PM.
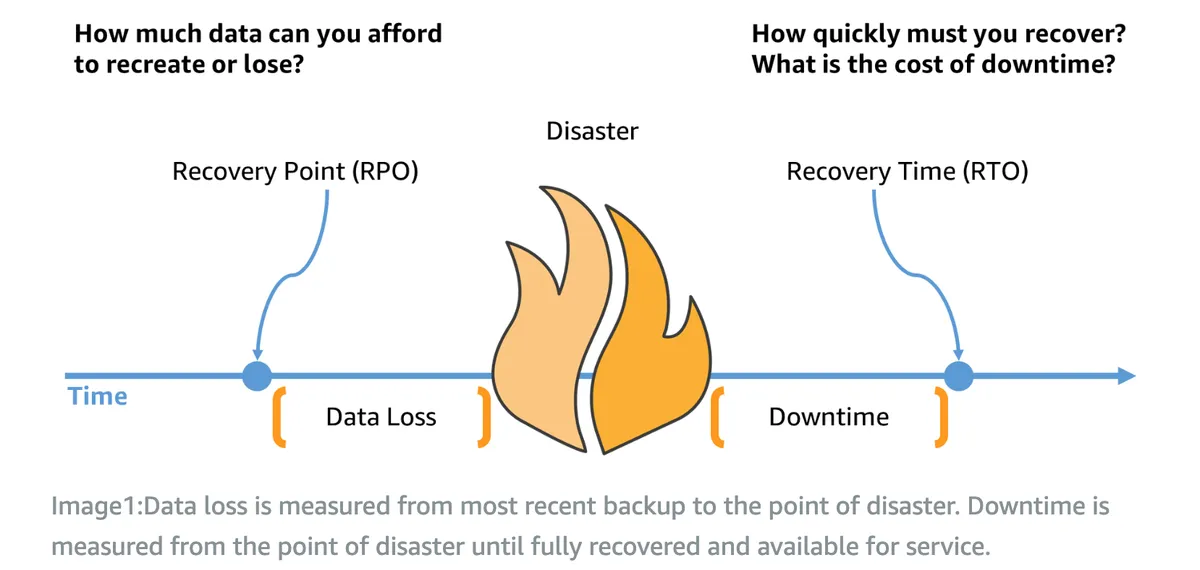
https://aws.amazon.com/blogs/mt/establishing-rpo-and-rto-targets-for-cloud-applications/
How to Estimate SLA
Follow these steps:
- Define what counts as a disaster in your service. Define the critical flows in the service and what infrastructure and application code are relevant to them.
- Calculate your current service SLI according to past incidents data. SLI foretells the future and helps assume how many incidents you will have in a year.
- Estimate your service RTO.
- Calculate yearly downtime in days: Assume how many incidents per year you can expect and multiply it by the RTO you calculated in step 3. Make sure to change it to a day unit.
- SLA formula: (365 - {downtime days}) / 365 \* 100 = SLA where 365 is 365 days which translates to yearly 24/7 service uptime.
SLA Estimation Example
Let's estimate SLA for a Serverless 'orders service' that enables customers to create and view orders of a product.
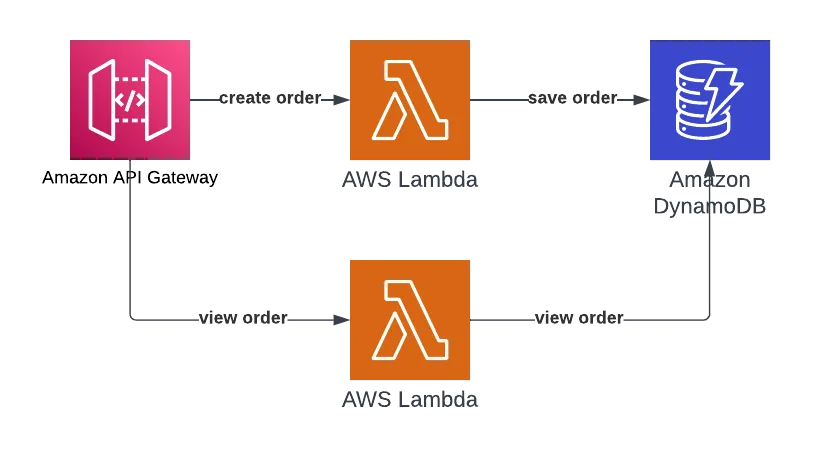
Let's follow the four steps of SLA estimation:
- Critical business flow - Create new customer orders. Viewing existing orders is not considered a vital flow.
- Current SLI - 99.99% (one past incident in production for about one hour)
- RTO: see estimation below. We will use a safer approach and assume future incidents require the team to debug and fix the issue instead of a simple code revert.
- Estimated two yearly incidents. Yearly downtime => 2\ RTO = 2\ 0.25 = 0.5 days of downtime over a year.
- SLA: (365-0.5)/365 \* 100 = 99.86% SLA
RTO Guestimation
The services' infrastructure layer uses AWS Lambda, Amazon API Gateway, and Amazon DynamoDB.
The service code quality is high; code coverage is around 90%
SLA of AWS service in use: minimum GUARANTEED SLA: 99.95%
We will guesstimate an RTO of 6 hours, which is 0.25 days, assuming future incidents take more time to investigate and debug than just a code revert that takes one hour. While the sole past incident took one hour to resolve, we understand it was the exception and not the norm. It's better to be on the safe side rather than promising estimations your team will find hard to deliver in the future.
In the future, when there are more past incident examples, we can fine-tune the RTO number to the actual incident average.
Note how the SLA is lower than our guaranteed AWS service SLA: 99.86 < 99.95. That makes sense, as we can have an SLA that is either lower/equal to the SLA of the AWS infrastructure and services we depend on but not higher!
Second note: our SLI is higher than the SLA, and we currently deliver better availability than promised to the customers.
How to Improve Your RTO - Preparing For Disaster
You should accept that it is just a matter of time until something terrible happens.
You can't prepare for everything, but you can have insurance policies and try to ready your team and service for many disasters.
Let's review some action items that can prepare your team for the worst, thus decreasing the RTO, improving availability, and improving the potential SLA percentage.
CI/CD Practices
Canary Deployment for AWS Lambda Functions
Canary deployment for AWS Lambda - for a production environment, use canary deployments with automatic rollbacks at first sight of AWS Lambda error logs or triggered AWS CloudWatch alarms.
Canary deployments gradually shift traffic to your new AWS Lambda version and revert the shift at the first sight of errors.
One way to achieve that is to use AWS Code Deploy with AWS Lambda.
Canary Deployment for Lambda Dynamic Configuration
Canary deployments are also relevant in the domain of dynamic application configuration.
Feature flags are a type of dynamic configuration and allow you quickly change the behavior of your AWS Lambda function. One way to improve feature release confidence is to turn a feature on or off quickly.
Crisis Recovery
Backups
Back up your data and customers' data.
Enable hourly backups of your DynamoDB tables, Aurora databases, OpenSearch indexes, or any other database entity. It's better to be safe than sorry.
Some services, like DynamoDB, offer automatic backups and ease of restoration.
The more frequent backup you do, the lower the RPO is.
The SOP (standard operating procedure)
- Have a support team 24/7
- Create clear processes to handle disasters.
Processes reduce RTO in case of a disaster.
Create a process for restoring production data from the backup.
Creating a backup is one thing, but restoring from a backup when the clock is ticking and upset customers are at your doorstep is another.
You should create a well-defined process to restore any database quickly and safely.
Develop the required scripts, define the restoration process (who runs it, when, how), test it in non-production environments, and train your support staff to use it.
In addition, you should Create a process for making ad-hoc changes/scripts/fixes on the production account. Sometimes you can't wait for a bug fix to deploy from the dev account to production, and it can take too much time to go through all the CI/CD pipeline stages.
Sometimes you need a quick, audited, and safe manner of changing production data.
Ensure it is audited, requires extra approvals, and does not break any regulations you are obligated to.
Practice running these scripts at least once per quarter.
Chaos engineering
Expect the unexpected. Outages and server errors are going to happen, even in Serverless.
You need to be prepared.
Use AWS Fault Injection Simulation to create chaos in your AWS account, have your AWS API calls fail, and see how your service behaves.
Try to design for failure as early as possible in your Serverless journey.
Observability & Support Readiness
Good observability and logging practices will help developers resolve issues quicker and be notified of a looming incident before the disaster happens thus reducing the RTO.
Correlation ID
In my eyes, the perfect debugging session is the one in that I can trace a single user activity across multiple services with just one id - the infamous correlation id value.
One way to achieve this experience is to inject a correlation id value into your service logs.
In addition, you must pass this value to any following call to services via request/event headers (AWS SNS attributes/HTTP headers, etc.).
See the Powertools Logger correlation ID example with AWS Lambda Powertools Logger.
Observability Dashboards
Create AWS CloudWatch dashboards that provide a high-level overview of your service status for your SRE team.
It should contain manageable error logs and service information, so non-developers can quickly pinpoint errors and their root cause.
Leave the complicated dashboards containing low-level service CloudWatch metrics to the developer's dashboards.
Work closely with the SRE team, add precise log messages describing service issues, and create the dashboard.
Read my Lambda observability best practices post.
Alerts
Define CloudWatch alerts on critical error logs or CloudWatch metrics that correlate to a severe service deficiency or denial of service.
These can include Lambda function crashes, latency issues, Lambda function timeouts, DynamoDB errors, Cognito login issues, etc.
Each alarm needs to be investigated and mitigated quickly.
Training
Invest time and effort in support training for developers and SREs.
Each dashboard error log or CloudWatch metric must have a predefined action for the SRE to take.
Include guidelines such as "If you see 'X' and 'Y,' it probably means that Z is an issue; follow these steps to mitigate Z."
Ensure the SREs understand the high-level event-driven architecture of the service so they can support it more efficiently.
Thank you Ronen Mintz for the review and feedback.


