
Chaos engineering is a proactive methodology that intentionally introduces controlled disruptions and failures into a system to uncover weaknesses, enhance resilience, and ensure robust performance in the face of unforeseen outages.
In this post, we will explore chaos engineering practices and provide an example code for running a chaos experiment within a serverless architecture deployed in AWS.
Additionally, we will leverage AWS FIS (Fault Injection Service) for enhanced experimentation.
This is the second part of a series of posts discussing chaos engineering in serverless architectures. It applies the concepts introduced in Part 1 of this series.
Chaos Engineering Definition
Cloud providers like AWS manage serverless architectures, but ensuring that your serverless applications are resilient is still essential. For instance, in an outage in one region, you want to ensure that your architecture is resilient and that your customers in other regions are unaffected.
Chaos engineering can help you simulate these outages and validate the resilience of your serverless applications. Following its principles, you can conduct chaos experiments that simulate a region failure and verify the system is functioning as expected.
Before diving into code, let’s briefly recap our sample architecture and the steps of an experiment we covered in Part 1.
We presented the following architecture:
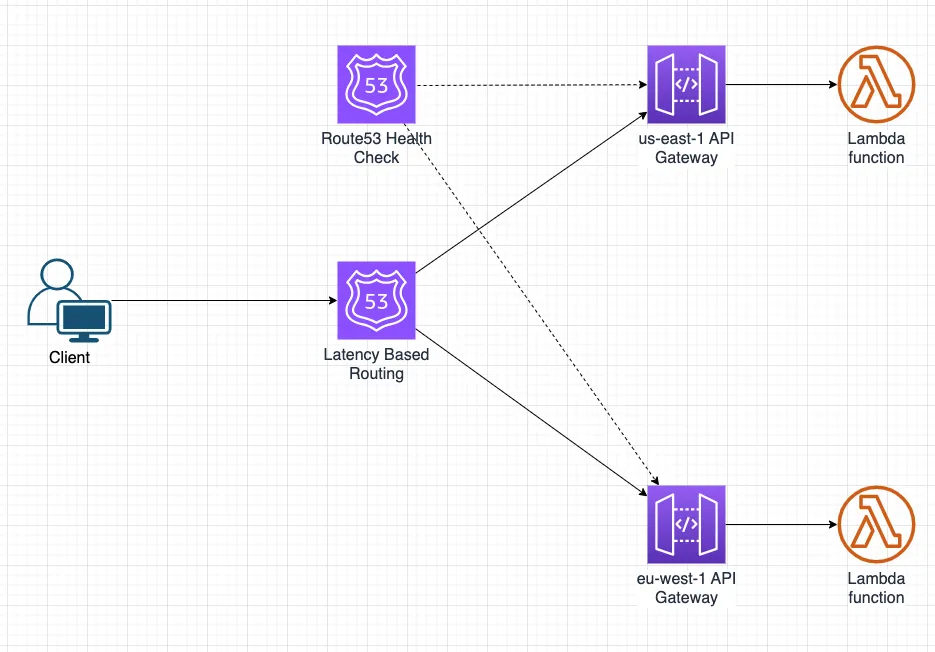
The architecture diagram presents a classic serverless architecture that runs on top of AWS. It consisted of the following resources:
- API hosted in Amazon API gateway. Our API is deployed into two regions, us-east-1 and eu-west-1, and exposes two paths: ‘/api/health’ for health checking and ‘/api/hello’ as our service API. Our health returns “Region {region} is healthy,” while our service API returns: “Hello from region {region}” (region marks the endpoint that handled the request, either ‘us-east-1’ or ‘eu-west-1’).
- There are two Lambda functions in each region. Our API triggers the functions (we have a dedicated Lambda per API). There is more on using Lambda with AWS API Gateway in the Lambda API Gateway integration docs.
- Custom domain registered in Amazon Route 53. Every regional API will get a dedicated custom domain stating the relevant region. For example:
example.{region}.mydomain.com(the region should be either ‘us’ or ‘eu,’ e.g.,example.us.mydomain.com). - Route53’s Latency-based routing points to our endpoints in both regions. The entry address should match
example.mydomain.com. - Route53’s health check to check the health of our APIs. Every regional API will have a dedicated health check that points to the relevant domain address:
https://example.{region}.mydomain.com/api/health.
Chaos Experiment Steps
We presented the four steps of a chaos experiment:
- Form a hypothesis (plan)
- Introduce stress/faults (do)
- Observe (check)
- Improve (act)
And defined the following hypothesis:
Given: We have a multi-region API gateway behind latency-based routing.
Hypothesis: Failure in one region does not affect other regions. Moreover, Route 53 failover should promptly detect the issue and reroute traffic to the healthy region.
This post will present how to experiment with AWS using AWS FIS to test our hypothesis. During our experiment, we will use a Lambda extension to inject faults into our Lambda functions (more on this below). See the first part for more information on the different approaches to injecting faults.
After presenting our hypothesis and explaining how we will inject faults into the Lambda function, we will start our experiment by first understanding how to validate our hypothesis during our Chaos experiment.
Preparing for Our First Experiment
Before running our experiment, it is essential to validate that the application behaves as expected and simulate user behavior within the system. Additionally, determining how the system functions from a customer’s point of view is crucial.
More specifically, if the US region is down, we need to be able to verify that it is down and that our EU customers are unaffected.
We will use Amazon CloudWatch to validate the application’s behavior and create a dashboard with a mixture of built-in and custom metrics. Using those metrics, we can monitor our application from both a system operator’s and a customer’s point of view. The metrics and dashboard are central to our experiment’s “observe” step. We will talk about those metrics in detail later in this post.
Defining the Experiment
Our experiment has two main parts. The first simulates customer behavior, while the second runs it and injects faults.
Customer Behavior Simulator: Simulating customer behavior is crucial as we want to first test our hypothesis in a controlled environment without affecting real customers. To simulate customer behavior, we will use an updated version of the load-gen application called “load-gen,” taken from AWS Chaos Engineering Workshop. This application can be deployed as a Lambda function and invoked to simulate load on a given API. For more information on the application and how to use it, see AWS Chaos Engineering Workshop.
Running our Experiment: We will use AWS FIS (Fault Injection Service) to run our experiment. AWS FIS is a fully managed service for running fault injection (Chaos) experiments in AWS. Unlike external tools, FIS injects faults directly through the AWS control plane, allowing it to mimic real-world issues specific to AWS services.
In addition to AWS FIS, we will use AWS System Manager, a service that manages your AWS resources and applications on-premises or in the cloud. We will write a custom automation document in AWS System Manager and use it from FIS. We will go into more detail later in this post.
AWS FIS Concepts
Here’s a breakdown of key AWS FIS concepts and how to leverage them for chaos engineering in our serverless environment:
- Experiment Template: This blueprint defines our experiment. It specifies the resources (e.g., Lambda functions) we want to target, the faults to inject (latency, errors), and stop conditions (duration, error thresholds).
- Actions: These are specific ways to disrupt our resources, like throttling network traffic or introducing delays. FIS provides pre-built actions or allows us to define custom ones. See the FIS actions reference for a list of supported actions.
- Targets: We want to inject faults into these AWS resources, like our Lambda functions.
- Stop Conditions: Define when the experiment should automatically stop. You can base the stop condition on a time limit, specific errors encountered, or exceeding resource utilization thresholds.
Now that we understand the services we will use to conduct our experiment let’s review the experiment stages and explain how we will use AWS FIS.
Experiment Steps
1 - Form a Hypothesis
Quick reminder: here is our hypothesis:
Given: We have a multi-region API gateway behind latency-based routing.
Hypothesis: Failure in one region does not affect other regions. Moreover, Route 53 failover should promptly detect the issue and reroute traffic to the healthy region.
2 - Introduce Faults (Chaos)
One can choose to inject different fault types into a Lambda function. This post will use the Latency fault type, which is simple and intuitive. This fault type introduces artificial delays in the Lambda execution by adding latency, which eventually causes failures due to timeouts. More on this below.
As of writing this blog, AWS FIS does not have pre-built actions for Lambda service, so we must resort to other approaches. We will use a Lambda extension to inject a Latency fault into our Lambda. Once connected to our Lambda, we can enable it by setting our Lambda environment variables and configuring it to add artificial delays during the Lambda invocation. You can read more on the extension in the official README file.
To connect the extension to our Lambda, we will use FIS’s aws:ssm:start-automation-execution action, which enables us to invoke an AWS System Manager automation document. For our purposes, we will develop an automation document that will:
- Get a Lambda and a Lambda extension ARN’s as parameters.
- Attach the extension to the Lambda.
- Enable fault injection (Chaos) by setting the Lambda’s environment variables.
- (Optional) Update a Lambda alias to point to our new version (more on this below).
See the AWS Systems Manager Automation documentation for more information about automation and the automation documents guide for more information about writing custom automation documents.
You can write automation documents in either JSON or YAML format. See the following YAML snippet for the list of parameters we will use in our document:
As you can see in the snippet, we have the following parameters:
- FunctionName — The name of the lambda function to add the layer.
- LayerArn — The ARN of the layer to add to the lambda function.
- AutomationAssumeRole — The ARN of the role that allows Automation to perform the actions on your behalf.
- ChaosMode — (Optional) Whether we want to enable or disable Chaos (defaults to enable).
- AliasName — (Optional) The name of the lambda alias that needs to be updated. A Lambda alias is a pointer to a function version, and we usually use it when connecting a Lambda function to an API Gateway. If you don’t use a Lambda alias, you can ignore this parameter and leave it empty.
The document takes the parameters and runs a Python script. You can see the following snippet containing the “handler” function, which is the main part of our script:
This Lambda function connects the extension and adds environment variables to enable Chaos (inject latency fault).
Our script also supports disabling Chaos (stopping the injection of faults) by detaching the extension and removing the added environment variables.
You can view the full SSM automation document.
FIS Experiment Definition
After reviewing our automation document, let’s revisit our FIS experiment template, which is a blueprint that defines our experiment. You can see the following example snippet of the FIS template we will use (partial):
In the snippet above, we can see our experiment contains the following actions:
- Attach Extension to Lambda - Enable Chaos in our Lambda by invoking our automation document. We will use the extension mentioned above while enabling the latency response type configured with 60 seconds. Enabling the latency response type will cause one of the following:
- Function timeout - this will happen if we configure our Lambda to run under 60 seconds.
- API Gateway API timeout — API Gateway has a maximum integration timeout of 30 seconds (hard limit).
- Wait - Wait 10 minutes. This action is essential as we must wait for enough traffic to validate our hypothesis later.
- Detach Extension from Lambda - Disable Chaos by invoking our automation document with the “ChaosMode” parameter set to “DISABLED.” This will revert our Lambda to its original state and complete the experiment.
It's important to note the snippet above focused on updating a single Lambda. However, in our case, we should extend it to inject faults to both Lambda functions in the US region: health check and service. Otherwise, we won’t simulate a regional failure in Lambda service.
For more information, see the AWS FIS experiment templates documentation.
3 - Observe
As mentioned above, to verify our hypothesis during the experiment, we will create a CloudWatch dashboard showing a mixture of built-in and custom metrics containing a dimension. You can read more in the CloudWatch custom metrics and dimensions documentation. The dashboard should provide us visibility of both regions and present the response code our customer receives. It will contain the following metrics:
- Route53 HealthCheckStatus — Using this built-in AWS metric, we can verify that our endpoint is considered unhealthy from a system operator’s point of view. We will monitor the metrics for our API in both regions.
region_{region}- a custom metric to mark the number of requests a particular region handles. We can calculate this value by parsing the response payload as our API returns "Hello from region {region}" in case of an HTTP 200 response code.- API invocation return code — several custom metrics to mark the HTTP response code returned from calling our API. We will have the following metrics:
status_2xx- number of 2xx responses.status_4xx- number of 4xx responses.status_5xx- number of 5xx responses.
Our custom behavior simulator mentioned above (the “load-gen” application) will publish our custom metrics and contain the invoked API as a dimension. Using our custom metrics, we can understand if a customer experiences a failure while calling our API and which API endpoint handled the request (‘us-east-1’ or ‘eu-west-1’ region).
For example, in case our API URL is https://example.mydomain.com and we get an HTTP 200 response code while calling the API by reaching the ‘us-east-1’ region, we will have the following metrics:
region_us-east-1: API -https://example.mydomain.com, value - 1status_2xx: API -https://example.mydomain.com, value - 1status_4xx: API -https://example.mydomain.com, value - 0status_5xx: API -https://example.mydomain.com, value - 0
4 - Improve
Once the experiment finishes running, we will view our dashboard and validate our hypothesis. We must fix any issue we discover and rerun our experiment.
Unleash Chaos Onto Our Architecture
Now that we have reviewed all the steps needed to conduct our experiment, we will go over the exact steps we will take to unleash Chaos:
- Deploy our sample architecture presented above.
- Start running our customer simulator (the load-gen application described above). We can run it as a Lambda function in the EU and US regions while ensuring both instances call the latency-based URL:
https://example.mydomain.com/api/hello. - Open our CloudWatch dashboard and verify everything is working correctly. We expect both our Route53 endpoints to be healthy and the clients in both regions to get an HTTP 200 response code.
- Start our FIS experiment.
- Once finished, look at our dashboard and validate our hypothesis. If we don’t see the expected behavior in the dashboard, we should check why, fix the problem, and rerun the experiment by returning to step 2.
After reviewing the steps we should take, let’s look at the following dashboard that monitored an experiment we conducted:
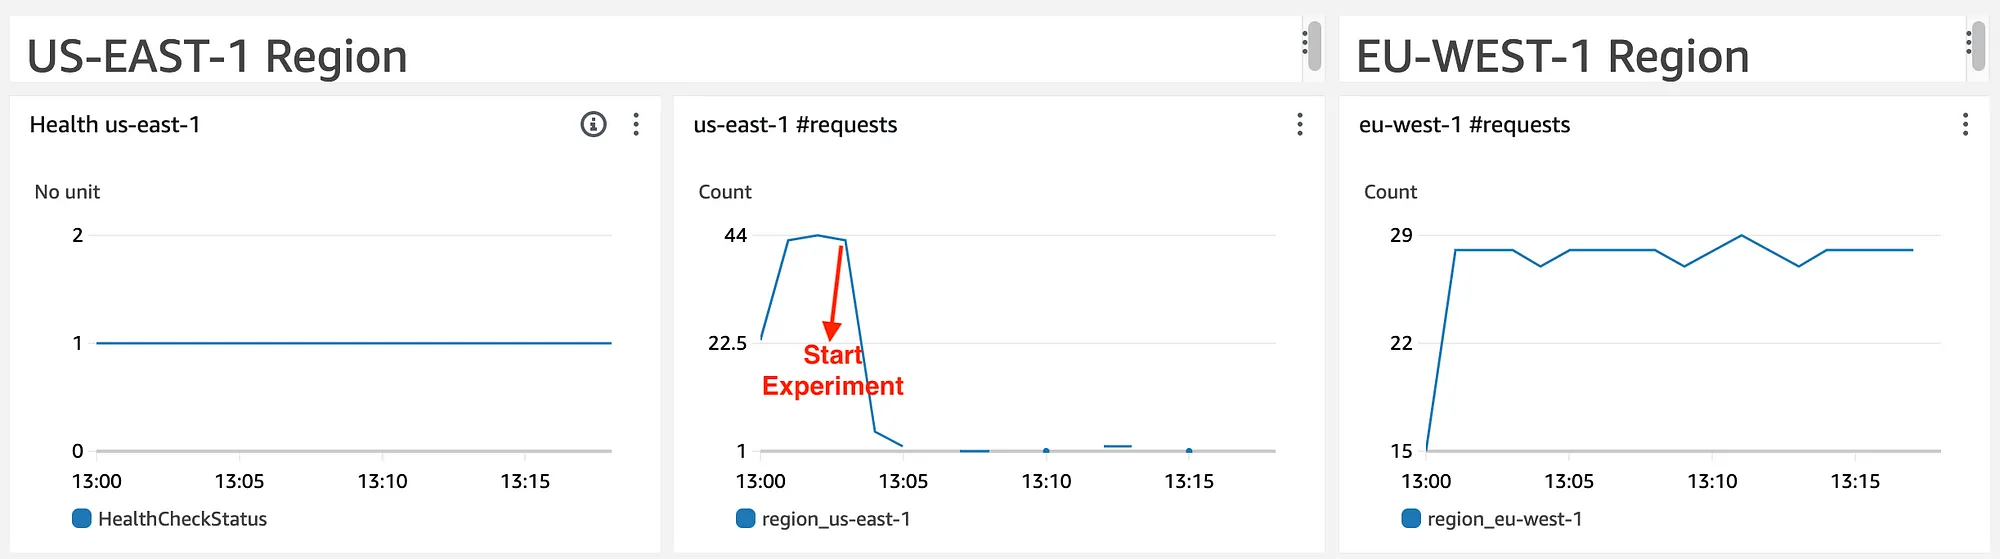
Let’s review the widgets in the dashboard from left to right:
- Health “us-east-1” - Displays the health of our US region endpoint (1 — healthy, 0 — unhealthy). This widget uses Route53 HealthCheckStatus.
- “us-east-1” #requests—Displays the number of requests that reached the US region. This widget uses our region value in our custom metric presented above.
- “eu-west-1” #requests — Same as widget 2 for the EU region.
This dashboard shows a hidden problem we have. Pause for a second and think: What might be the problem in our case?
We have about 44 requests in our US and about 29 in our EU regions. Once we start our experiment (marked in the red arrow), we see a decline in requests reaching the US region while the EU remains constant. We don’t see an increase in requests reaching the EU region, as we expect Route 53 failover to kick in and route traffic from our unhealthy region.
The clue to the problem is that our US endpoint is considered healthy throughout our experiment (widget 1); however, we expect it to be unhealthy. As both endpoints are deemed healthy, Route53 keeps pointing US customers to the US endpoint, causing them to fail instead of moving them to the EU region.
What is the problem? We accidentally configured our US health check to point to example.eu.mydomain.com instead of example.us.mydomain.com.
It’s great! We found a problem, and the experiment was beneficial!
Our US customers would have experienced an outage during an actual regional outage instead of being moved to the European region.
Let’s fix it and rerun the experiment.
Validating the Fix
After fixing the problem, let’s look at the following dashboard:
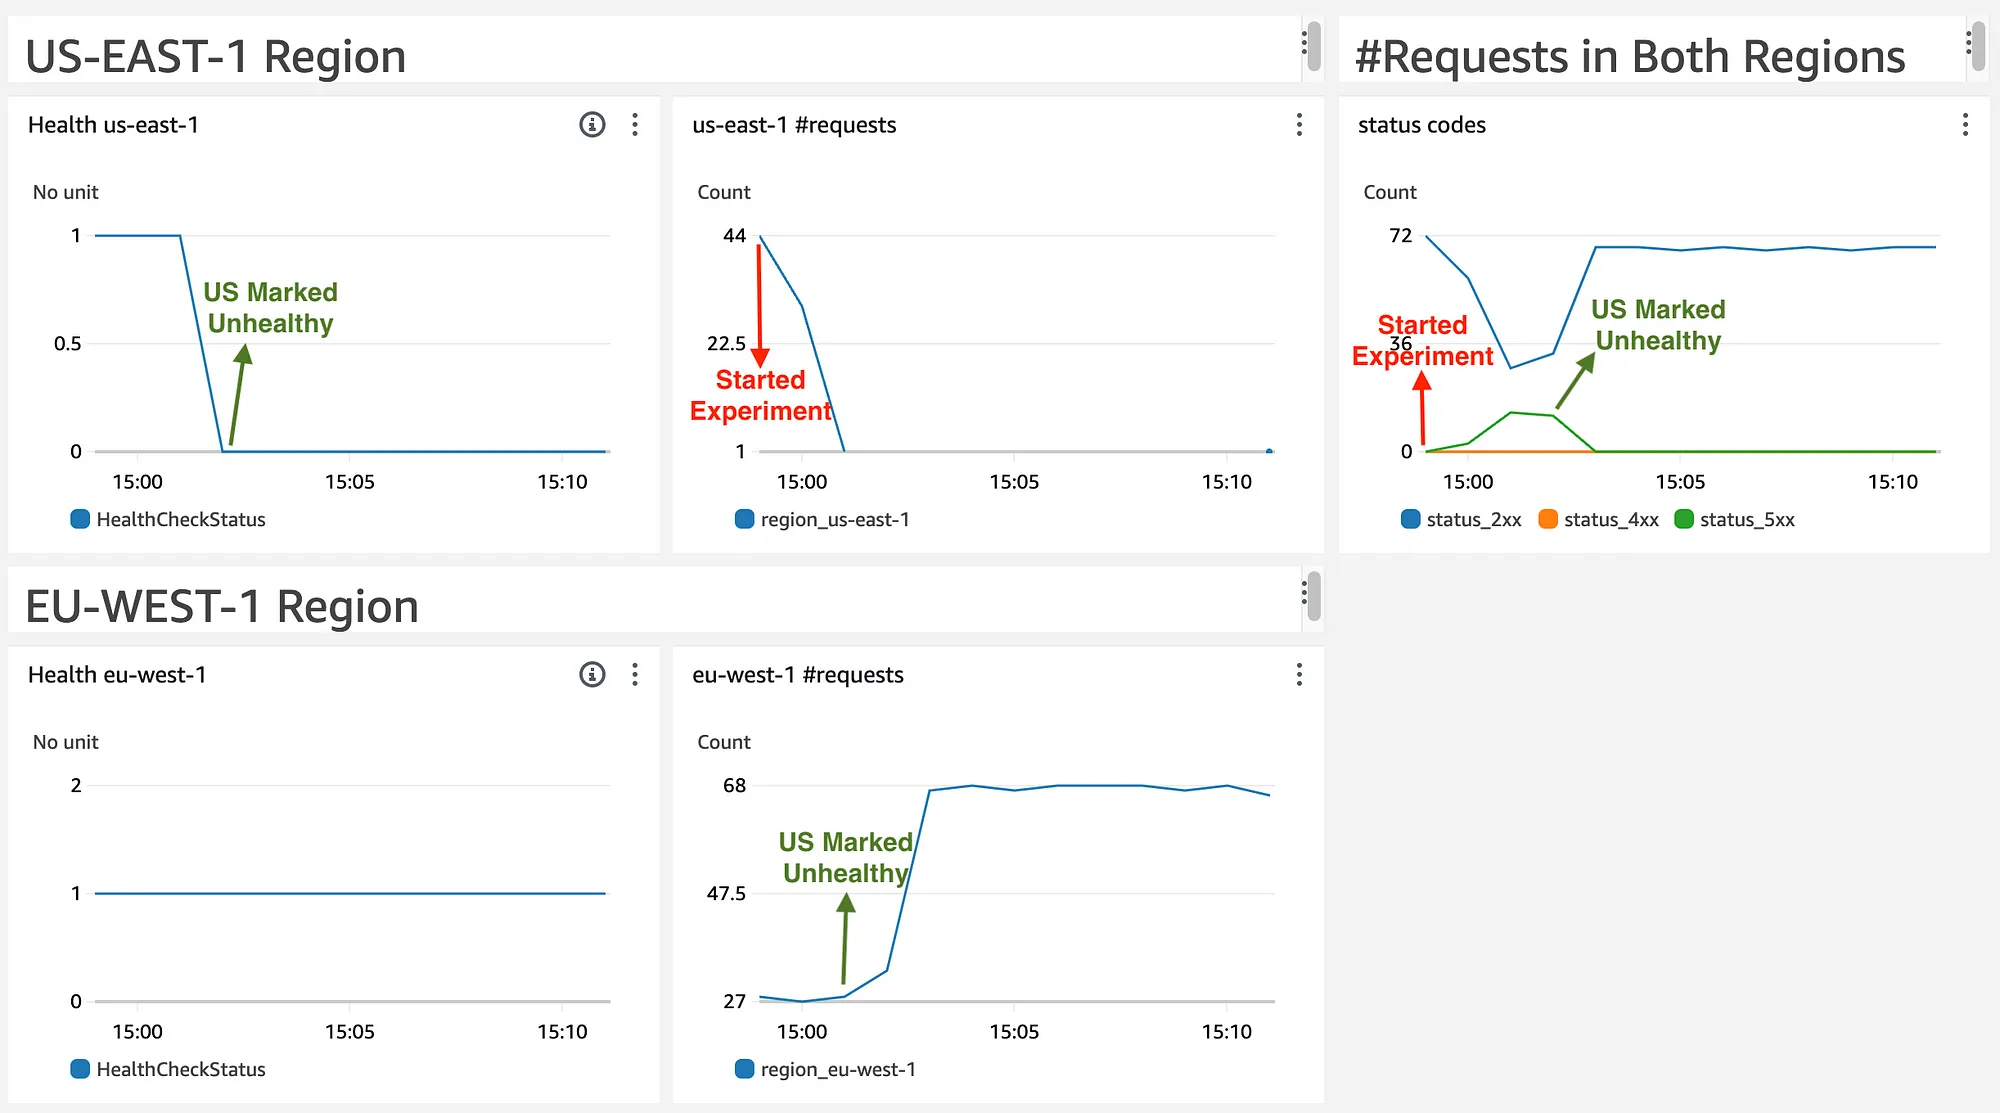
In this dashboard, we added another widget (the last one in the first row), presenting the status codes returned by invoking our APIs. It uses our API invocation custom metric mentioned above.
We see everything is working as expected: once we start our experiment (red arrow), we see a decrease in us-east-1 requests with a matching increase in the number of HTTP 5xx status codes (the last widget on the first row). After a few minutes, Route53 failover kicks in, marking our US endpoint as unhealthy (green arrow in the first widget in the first row) and routing all traffic to the EU region. We can validate it by seeing an increase in requests reaching the EU region (the last widget in the second row) and a matching decrease in the HTTP 5xx response codes (status codes component in the first row).
Summary
That’s it for now. In this post, we took the example architecture and concepts presented in the first part and put them into practice. We ran an experiment using AWS FIS and a custom SSM document, found a misconfiguration, and fixed it. We are now ready for a regional downtime.
I hope you find this post (and the previous one) useful and practical and encourage you to test your serverless architectures. You might be surprised by what you’ll see :)
Special Thanks
I'd like to thank Ran Isenberg and Maxim Drobachevsky for taking the time to review this post and providing their valuable feedback.