
Maintaining a production system can be challenging. Ideally, we want to create a seamless experience for our customers; however, bugs will happen occasionally, and it's crucial to find them as early as possible to have minimal impact on your users.
Synthetic tests that simulate real user actions in the application can alert you when a critical flow breaks.
In this post, you will learn how to improve your service availability and observability using AWS CloudWatch Synthetics, so you can detect issues before your customers do.
The complexity of detecting production issues
Over time, as your service grows, your API evolves beyond a simple set of routes. Your team has grown, and multiple developers are now working full-time to add more features to your product. Don't get me wrong—that’s a good thing, but with your codebase growing, it's getting harder to detect issues.
There are many ways to prevent potential bugs. You can create monitors based on your CloudWatch logs to catch 4xx and 5xx high rates of errors. You can use Route53 health checks to verify that the resources your service depends on are up and running. You can create dashboards for monitoring errors at the API or client level, use metrics, and much more.
Those tools were designed to ensure your customers have a smooth and reliable experience using your system. While these tools are valuable, they represent a reactive approach; you are alerted only after an issue occurs, often by angry customers.
A more proactive approach is to monitor real user actions in your service. This way, you can get a complete picture of the user's interaction with the system, making it a key part of your monitoring strategy.
What are synthetic tests
Synthetic tests simulate operations that a real user would perform in your service. For example, they would log in to the system, click buttons, open menus or dialogs, and fill out forms.
Instead of hiring a group of human testers to use the website and report issues constantly, we can automate the process using synthetic tests. We can run them in multiple regions, allowing us to detect the region-specific problems and ensure persistent low latency. We can run it every few minutes, focusing on the most critical flows we want to check.
Like every other automated process, you will have to maintain the tests and update them from time to time as your app changes. Sometimes, alerts may be triggered due to issues in the test scripts themselves, even if the app is healthy. However, it’s still worth taking a look, as there’s a high chance the alert indicates a real problem.
A good synthetic testing tool should gather all the information you need in a centralized place: logs, screenshots, and a HAR (HTTP Archive) file that can help you investigate the issue more effectively. It should also allow you to send alerts to notify your team when an anomaly is detected.
In addition, it should integrate with your service infrastructure as code and CI/CD pipelines, and continuously validate your website's availability through scheduled tests.
Next, we will demonstrate the importance of those tests using a sample service- a music streaming service.
Sample service introduction - music streaming service
For a streaming service, the most important thing is high availability; if users fail to get their favorite track, they will lose confidence in the product, leading them to competitors. That's why continuous monitoring is essential. To understand how we can achieve this in the music streaming app, let's break down the architecture:
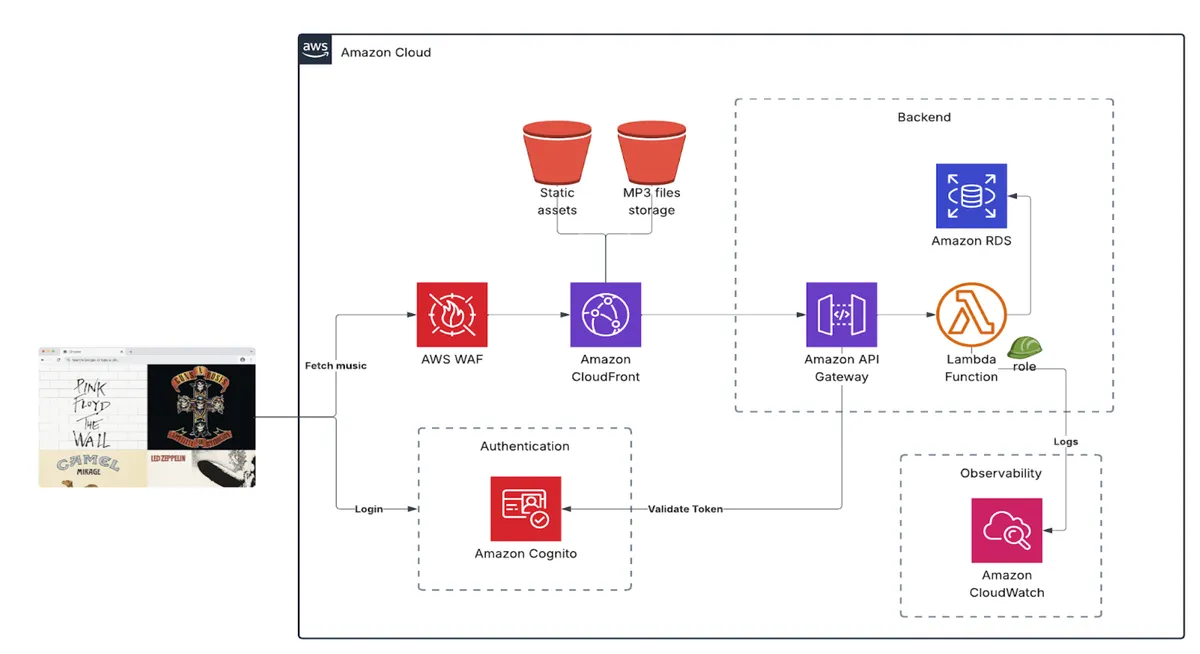
For the Frontend of our app, we will use CloudFront as our CDN service and S3 buckets, holding static assets and serving MP3 files. We will use WAF to secure our app and prevent attacks. For authentication and authorization, we will use Cognito. Our Backend will consist of an API Gateway and lambda functions, allowing us to fetch user settings such as playlists and favorite tracks. In RDS, we will keep the files' metadata: artist, album artwork, track name, track number in the album, etc. We will also use CloudWatch for logging and monitoring.
Although it's a pretty straightforward architecture with not as many services, there are still a lot of possible points of failure. To minimize those, we should add tests to every new feature we develop and make them part of our CI. Sometimes, though, it's not enough. Every app depends on other services, machines, and infrastructure, which can cause outages. We still need a tool that can simulate a full E2E flow of the user and alert us as soon as the system is down, allowing us to fix it immediately.
Before we proceed to the implementation, we need to map the flow of the test - a complete user interaction with our app:
- Navigating to our app’s domain
- Logging in with credentials
- Fetching the user's playlist
- Selecting a song from the playlist
- Moving to the song screen and verifying that all the details are correct
- Playing the song
Now that we understand the flow, let's write synthetic tests using AWS.
How to implement synthetic tests using AWS
Synthetic tests in AWS can be implemented using a CloudWatch feature called Synthetic Canaries. Canaries are scripts that run periodically based on your preferences. In the script, we will test both the frontend and backend of our app by fetching real content from the server and verifying that the UI app acts as expected.
AWS gives the option to create canaries from blueprints. For example, the heartbeat monitoring blueprint checks that your website is accessible. You can also upload your script using the Inline Editor. If you already have a Playwright script and want to convert it to Synthetics syntax, see thisguide.
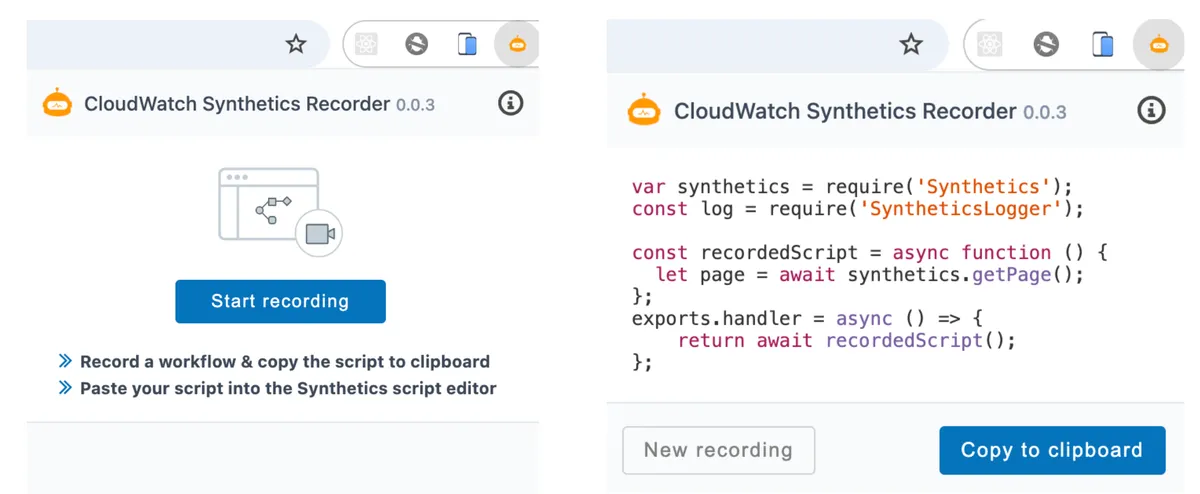
Another option is to use the Canary recorder to create the script. The recorder generates a canary script based on actions you perform in your application. First, download the AWS Synthetics Recorder Chrome plugin. With the plugin installed, navigate to your website, click 'new recording', and do the operations you want to include in the test. When you finish, click 'end recording' and the plugin will generate the test according to the CSS classes of your UI elements. Note that the test depends on those class names, so if you change them, you'll have to modify the script as well. Of course, later you can enhance the script with more complex verifications and steps according to your needs.
Canary Script Detailed Look
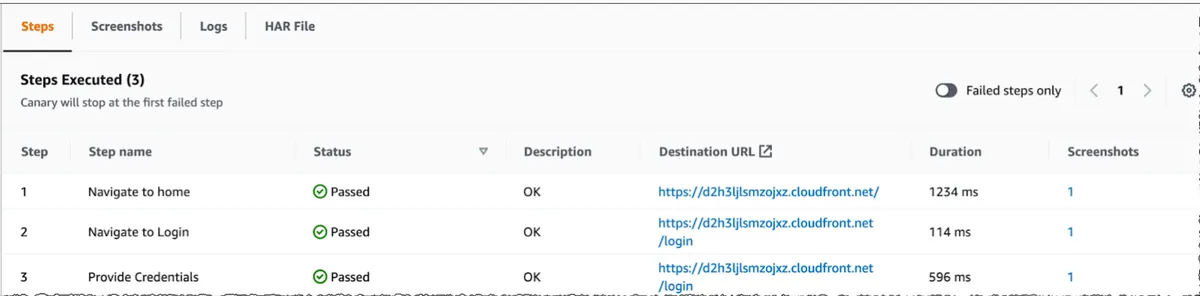
A Canary script consists of steps, which you can later review in the Canary runs screen. It’s important to break down the tests into small steps for easy investigation. The chrome plugin generates generic step names by default, so I recommend changing them to the actual user actions, making the investigation easier later.
CloudWatch takes before-and-after screenshots automatically for each step, making the investigation process easy. In addition, it provides an HAR file for the canary execution, which shows all the network activity during the test, including our API calls to the server.
The auto-generated canary script includes hard-coded values that we would like to retrieve at runtime. For example, our website URL and user credentials. Start by saving the website's URL in AWS Systems Manager (SSM) Parameter Store. For the login process, let's create a dedicated application user in AWS Cognito and store its credentials in AWS Secrets Manager, which allows us to store secrets securely. Make sure to add the relevant permissions for SSM and Secrets Manager to the canary IAM role to fetch those arguments.
Check out this code example on how to fetch the parameters:
In addition, you can create environment variables for the canary scripts. In this example, we will create 3 variables for the region, the URL parameter name in SSM, and the credentials secret name in Secrets Manager. To retrieve the environment variables in the script, use this syntax: “process.env.
Here is a code example of a canary script for our streaming website flow:
Proactive Monitoring and Failure Handling
Let's continue the canary creation flow and configure scheduling for the canary executions. We recommend running the canary frequently to catch errors as soon as possible. In the streaming app case, we'll configure it to run every 1 minute.
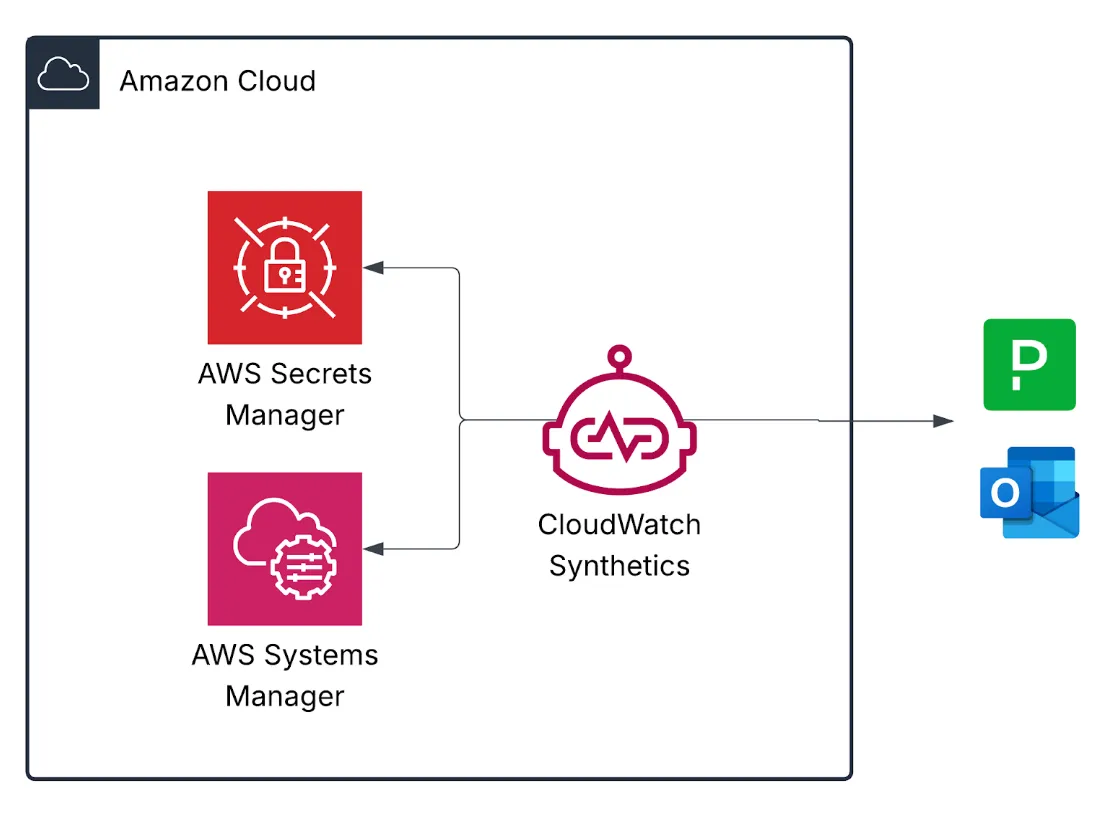
Canary creates a CloudWatch alarm to notify you in case of failure. To get alerts on every canary failure, we can set the alarm to be based on the 'Failed' metric, with a condition of greater than zero over a 1-minute period. Later, we link the alarm to an SNS Topic, which can be integrated with email, PagerDuty, or other notification systems you use. After the canary creation process, you can add more actions to the alarm and more subscriptions to the topic.
The alert will not spam you if it gets into a fail state, even though the canary is triggered every minute. An alert will be sent only upon status change.
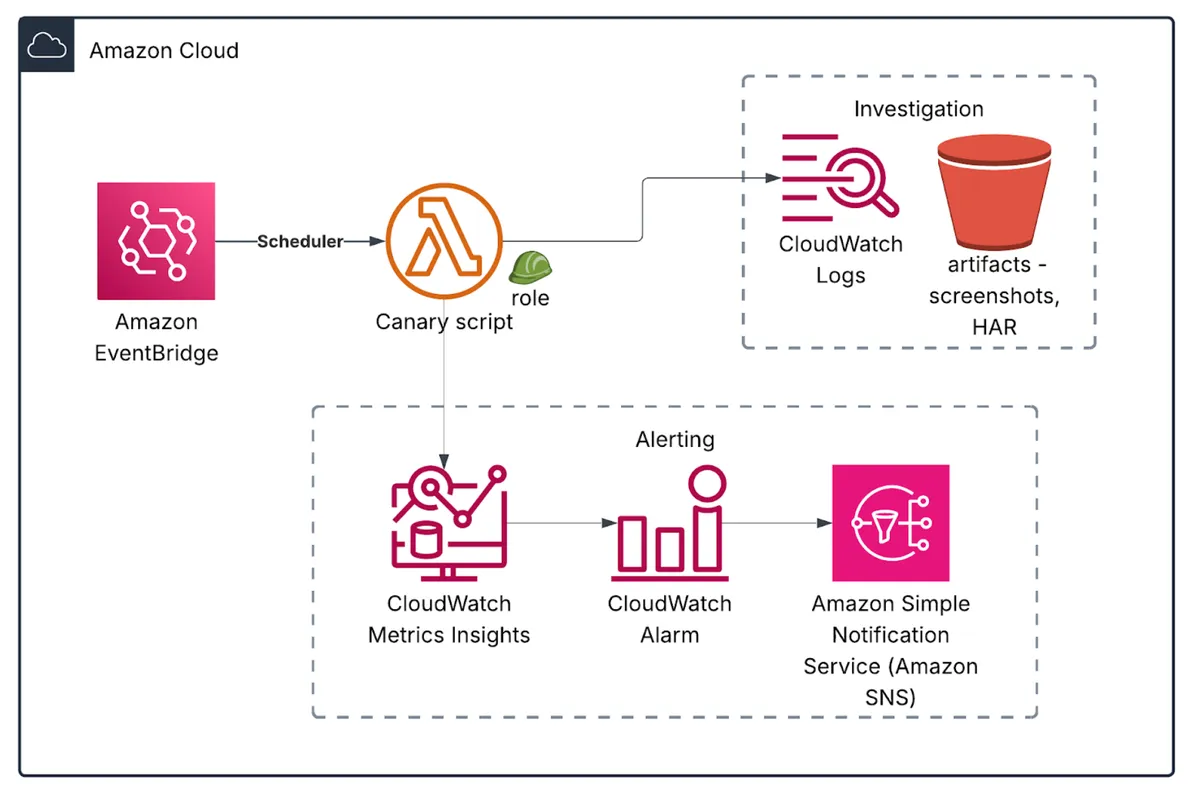
In a few simple steps, we created a complete infrastructure for running our full E2E tests. We have a Lambda function to run the test, a scheduler to trigger it periodically, logs, an S3 bucket to store investigation artifacts, and an alerting mechanism.
Here’s what we built:
Insights from working with the CW Synthetics tool
Overall, I had a great experience working with CloudWatch Synthetics; the developer experience is top-notch.
CW Synthetics make a huge difference in terms of development time. Implementing this infrastructure by yourself will require great effort. Before using this tool, I implemented synthetic tests by creating a Lambda function triggered by EventBridge Scheduler. For investigation, I created a bucket for the screenshots and built the test script from scratch and I didn’t have HAR files or the screenshots. All this comes as a black box in Synthetics, reducing development time significantly.
Using the Canary Recorder Chrome plugin is a game-changer, as you don’t need to write the code for the script - anyone who has worked with tools like Puppeteer or Playwright knows it takes a lot of time writing those kinds of tests.
It is much more convenient to debug issues using the console. Everything you need can be found in a single place. Screenshots, logs, and HAR files are under the Canary run details page. In my previous implementation, I had to navigate to the AWS Lambda service to see logs and go to the relevant folder in the S3 bucket for the screenshots. In synthetics, all those gathered on a single page, allowing you to react more quickly to errors.
On the other hand, value comes at a price. As of the date of this post, each canary run costs $0.0012. In our example, we run a canary every minute. Let's calculate how much it would cost in a month:
We would have 60 runs per hour 24 hours per day 31 days per month = 44,640 canary runs. Double it with the cost per run and you'll get $53.57 per month. As we know, the canary runs on a lambda, so we need to add the duration charges. S3 charges for saving screenshots, and CloudWatch logs - you get the point. However, I think it's a reasonable price to pay for constant monitoring and maintaining high availability for your product.
Summary
CloudWatch Synthetics can help you improve your service availability by running synthetic tests. Using AWS Console or CDK code, you can create all the infrastructure you need to run full e2e tests of the most critical flows of your service. You can get alerts when things go south and configure it to run periodically, allowing you to respond quickly to possible incidents. In addition, you get a convenient platform for debugging, with screenshots, logs, and HAR files generated for you. This is one additional tool to add to your stack, and a powerful one, too.